“An exposé of planetary scale.”
~JAMES E. HANSEN  
 
Clearing the PR Pollution that Clouds Climate Science

Desmog Video

You need Flash player 8+ and JavaScript enabled to view this video.


Arctic Sea Ice Taking a Turn for the Worse

The National Snow and Ice Data Center in Boulder, Co., has posted an update on the state of Arctic ice, saying that current conditions point to a bad year, but not a record-breaker.

If the daily rate of decline this August follows the average August rate of decline for 1979 to 2000, the daily sea ice minimum in September would be 5.00 million square kilometers (1.93 million square miles), considerably higher than the record minimum of 4.13 million square kilometers (1.59 million square miles) observed for September 16, 2007.”

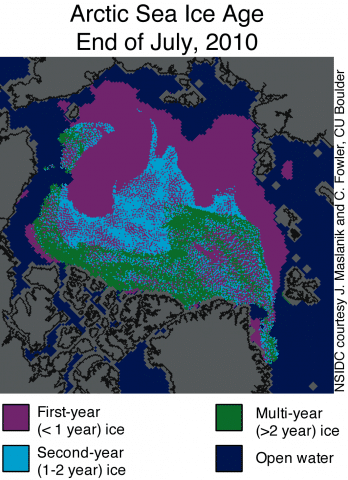
But if you look at the current graph, the ice is NOT following “the average August rate of decline.” And if you look closely at the inset illustration showing the distribution of multi-year ice, and then read the NSIDC analysis under the heading, “Older, thicker ice melting in the southern Beaufort Sea,you will see the threat of long-term ice collapse.

The illustration shows a significant sprinkling of old ice that has been distributed into highly exposed and relatively warm areas of the Beaufort and Chukchi seas. That ice is likely to melt in the coming weeks, reducing the gross amount of resilient old ice and making the entire ice cover more fragile in coming years.

For those of you who haven’t discovered it already, the NSIDC link above will take you to a graph that is updated daily - providing an interesting, if slightly unsettling stop for anyone interested in indicators of the state of the climate.


Comment viewing options

Select your preferred way to display the comments and click "Save settings" to activate your changes.

2012 the end of the world as we know it

The NSIDC daily extent chart shows white in areas which are as low as 15% ice cover. The concentration version of the same chart gives more information about the current state of ice.

http://nsidc.org/data/seaice_index/images/daily_images/N_daily_concentration_hires.png

shows the McClure Parry NW passage as largely ice free.

The Canadian Ice Service seems to show a higher level of ice cover, although the Aug 6 coverage for is the lowest in 5 years

http://ice-glaces.ec.gc.ca/IceGraph103/?id=11874&lang=eng

http://ice-glaces.ec.gc.ca/IceGraph103/CwtClimChtSrvlt?region=cwa04_01&nrmlsta=2000&nrmlend=2010&sizex=1230&sizey=780&lang=en&showwarn=false&plotnormal=true&plotmedian=false&plottrend=false&plotwarn=false&plotscaled=false&cachelife=1&errorpage=/page2.jsp&charttype=sdtt&ssnsta=2006&ssnend=2010&histdtsta=0806&histdtend=0806&format=ct

http://ice-glaces.ec.gc.ca/IceGraph103/CwtClimChtSrvlt?region=cwa04_01&nrmlsta=2000&nrmlend=2010&sizex=1230&sizey=780&lang=en&showwarn=false&plotnormal=true&plotmedian=false&plottrend=false&plotwarn=false&plotscaled=false&cachelife=1&errorpage=/page2.jsp&charttype=stac&ssnsta=2006&ssnend=2010&histdtsta=0101&histdtend=1225&format=ct

http://ice-glaces.ec.gc.ca/IceGraph103/CwtClimChtSrvlt?region=cwa04_01&nrmlsta=2000&nrmlend=2010&sizex=1230&sizey=780&lang=en&showwarn=false&plotnormal=true&plotmedian=false&plottrend=false&plotwarn=false&plotscaled=false&cachelife=1&errorpage=/page2.jsp&charttype=awtt&ssnsta=2006&ssnend=2010&histdtsta=0101&histdtend=1225&format=ct

http://ice-glaces.ec.gc.ca/IceGraph103/CwtClimChtSrvlt?region=cwa04_01&nrmlsta=2000&nrmlend=2010&sizex=1230&sizey=780&lang=en&showwarn=false&plotnormal=true&plotmedian=false&plottrend=false&plotwarn=false&plotscaled=false&cachelife=1&errorpage=/page2.jsp&charttype=awss&ssnsta=2010&ssnend=2010&histdtsta=0101&histdtend=1225&format=ct

The link to the NSIDC.ORG arctic sea ice extent graph is self-updating every day. In is no longer showing the downward slope it had on August 5.

if you also check the density map (http://nsidc.org/data/seaice_index/images/daily_images/N_daily_concentration_hires.png -- thanks for the citation, Kelly!) you will get a more meaningful sense of ice conditions. The extent graph doesn't give any detail about what the integrity of the ice is.

And surely the point here is that every year lately, the ice drops far below historic levels. People who actually go to the Arctic to inspect conditions have been consistently shocked by the "Swiss cheese" pack. We are picking apart the graph looking for daily action up or down, but the real story is that the average line for 1989-2010 +/- 2 standard deviations is going to be lower across the graph than 1979-2000.

Fern

as you can see, its getting worst but the natural disaster we don't know when is to happen but we do hope each one of us will do care for our nature and be responsible and discipline in order to control such things.

The ice area is not currently declining as rapidly as 2007, but the NW passage is nearly open. See the Concentration shart. In addition the 2 large areas of open water which opened in the Beaufort Sea last week merged and have opened toward the Bering Straight.
http://nsidc.org/data/seaice_index/images/daily_images/N_daily_concentration_hires.png

See also
http://nsidc.org/arcticseaicenews/
and
http://nsidc.org/images/arcticseaicenews/20100817_Figure3.png
showing the coverage area for the 1963 to 2000 average, 1999, 2007, 2008 and 2010 in a single chart, for easy comparison.
The Aug 10 - 13image portion of Figure 3 shows how thin the ice was in much of the area covered by 15% or more sea ice.

http://nsidc.org/data/seaice_index/images/daily_images/N_daily_concentration_hires.png

Your article is really alarming not just in the Arctic Sea. It is worldwide who is truly suffering from this devastating global warming. We should act now before everything is put to waste.

Comment viewing options

Select your preferred way to display the comments and click "Save settings" to activate your changes.

FOLLOW US!
 
SUBSCRIBE TO OUR E-NEWSLETTER
Get our Top 5 stories in your inbox weekly.
DESMOG TIP JAR
Help us clear the PR pollution that clouds climate science.

About the climate cover-up

About the climate cover-up

Democracy is utterly dependent upon an electorate that is accurately informed. In promoting climate change denial (and often denying their responsibility for doing so) industry has done more than endanger the environment. It has undermined democracy.

There is a vast difference between putting forth a point of view, honestly held, and intentionally sowing the seeds of confusion. Free speech does not include the right to deceive. Deception is not a point of view. And the right to disagree does not include a right to intentionally subvert the public awareness.

www.know-the-number.com

Our Climate is Changing!
Please download Flash Player.