Arctic Sea Ice Trends: Down, Down Down

authordefault
on

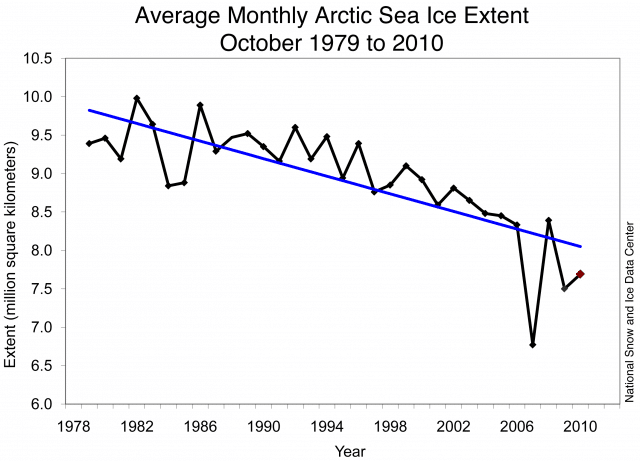
Two graphs, inluding the brand new one to the left, show two (mutually affirming) analyses of the trajectory of Arctic sea ice over the last 30 years.

The National Snow and Ice Data Center graph (left) shows Average Monthly Sea Ice Extent. The figure below shows a Polar Science Center model-generated calculation of Sea Ice Volume. Notwithstanding that NSIDC reports Arctic temperatures in October were 4 to 6 degrees Celsius (7 to 10 degrees Fahrenheit) higher than normal, there is something chilling in the similarity of the two graphs. 

PIOMAS Ice Volume Anomaly

Related Posts

on

From South Africa to Ukraine, five industrial chicken companies that supply KFC have benefited from financing from the World Bank Group and the European Bank for Reconstruction and Development.

From South Africa to Ukraine, five industrial chicken companies that supply KFC have benefited from financing from the World Bank Group and the European Bank for Reconstruction and Development.
on

It’s an effort by the oil sands group to deflect attention away from a long record of misleading climate claims, disinformation expert argues.

It’s an effort by the oil sands group to deflect attention away from a long record of misleading climate claims, disinformation expert argues.
on

The former prime minister attacks flagship climate deals and makes false claims about electric vehicles, Russia’s influence on energy policies, and net zero.

The former prime minister attacks flagship climate deals and makes false claims about electric vehicles, Russia’s influence on energy policies, and net zero.
on

The conference featuring Nigel Farage and Suella Braverman descended into chaos as police were called.

The conference featuring Nigel Farage and Suella Braverman descended into chaos as police were called.