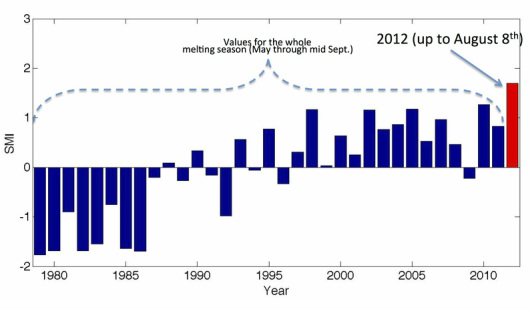
It’s been a “Goliath,” record-setting melting year in Greenland, home of the world’s second largest ice shelf. On August 8th, a full four weeks before the end of “melting season,” cumulative melting on the island had exceeded the previous record set in 2010, which included the full season.
The record melt was figured by the “cumulative melting index,” created by researcher Marco Tedesco of The City College of New York’s Cryosphere Processes Laboratory to measure the “strength” of the melting season. The index is basically the number of days when melting occurs multiplied by the physical area that is subject to melting.
Tedesco said in a statement, “With more yet to come in August, this year’s overall melting will fall way above the old records. That’s a goliath year – the greatest melt since satellite recording began in 1979.”
Earlier this summer, much was made of a massive melt event on Greenland, during which 97 percent of the island’s ice sheet surface area experienced thaw and melt over a short couple of days. While the event was startling, and a direct result of record high surface air temperatures, this measure of the overall melting is far more alarming.
The mid-July event, according to Tedesco, “generated liquid water that refroze after a few days, changing the physical properties of the snowpack but very likely not contributing to the meltwater that run offs from the ice and can potentially contribute to sea level rise.”
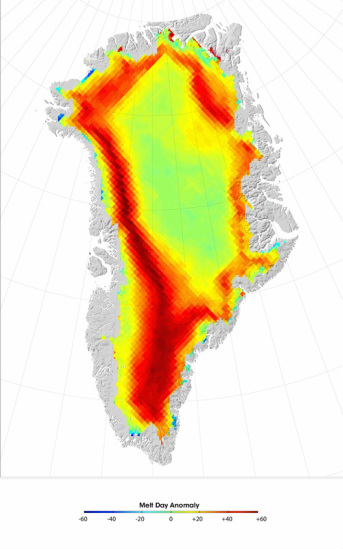
The cumulative melting index, on the other hand, accounts for longer-term melting trends, during which meltwater can flow into the ocean. According to Tedesco’s research, Greenland experienced “extreme” melting across most regions, especially in the south, west, northwest and northeast, particularly at high elevations.
These high elevation areas, according to Tedesco, “are generally subject to a few days of melting (if it happens at all) and this year they underwent melting for more than 2 months (so far).
But perhaps a map is worth a thousand words. Here you see the 2012 anomaly of the number of melting days with respect to a 20 year average from 1980-1999. The areas in red are where melting lasted for up to 50 days more than that baseline.
Of course, plenty of deniers will argue that Greenland was once green, and that melt events like this occur regularly and Medieval Warm Period and so on and so forth.
To which you can reply: the surface air temperatures in Greenland are warmer now than at any point in recorded history, dating back 172 years, and are likely, according to Jason Box of Ohio State University, the highest they’ve been since the time the Norse colonized Greenland in 982.
And, yes, while temperatures were abnormally warm in Greenland then, during the Medieval Warm Period, globally temperatures were actually cooler than they are today.
As this handy map reveals, over much of the globe, temperatures were actually cooler during the MWP, relative to the averages from 1961-1990.
In other words, the Medieval Warm Period was really a regional, not global phenomenon. The warming trends we see today are global, as this next map clearly shows, also based on temperature variation from the same 1961-1990 baseline.
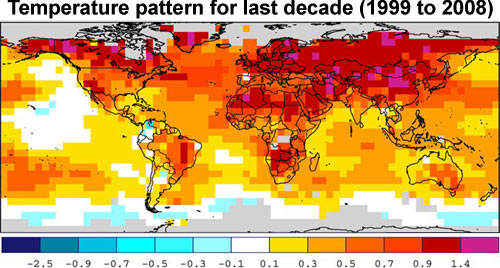
(Both maps courtesy of Skeptical Science)
And what’s more: the warming of the Medieval Warm Period was caused by factors that simply aren’t in play today, specifically solar radiation. The causes of the Medieval Warm Period’s regional temperature increases aren’t the same as those causing the global increases today.
So, it’s true, as Tedesco warned, that “we have to be careful because we are only talking about a couple of years and the history of Greenland happened over millennia.”
But he continues, “the warming that we see in the Arctic is responsible for triggering processes that enhance melting and for the feedback mechanisms that keep it going. Looking over the past few years, the exception has become part of the norm.”
And it’s worth keeping in mind that what we’re seeing has been forecast by climate models that warn of sea level rise driven by ice loss from Greenland. The only difference is that these models didn’t anticipate so much warming – and melting – so soon.