
The previous post in this series examined the Global Warming Policy Foundation (GWPF) Briefing Paper No3 “The Truth About Greenhouse Gases”. Despite its title, Briefing Paper No3 said very little about such gases. Yet one subject (not directly to do with greenhouse gases) was discussed at some length within the paper. As it is also discussed in other GWPF papers, the subject will be examined in this fourth post of the series.
AN IMPOSSIBLE HOCKEY STICK AVERSION
In Briefing Paper No3, perhaps the strongest accusation made by the author Professor William Happer concerns the IPCC who allegedly “rewrote the climate history” by deleting the Medieval Warm Period and Little Ice Age (MWP & LIA) from the climate record.
Happer tells us that both MWP & LIA were “clearly shown in the 1990” first IPCC report. Then eleven years later, according to Happer, they were both simply expunged from the climate record for no valid reason.
Indeed, within the 2001 third IPCC report the MWP & LIA are entirely absent from the graph that according to Happer is “not supported by observational data.” This is the dreaded “Hockey Stick” curve.
Can the IPCC really be responsible for such skulduggery?
“CLIMATE HISTORY” OR A STAB IN THE DARK?
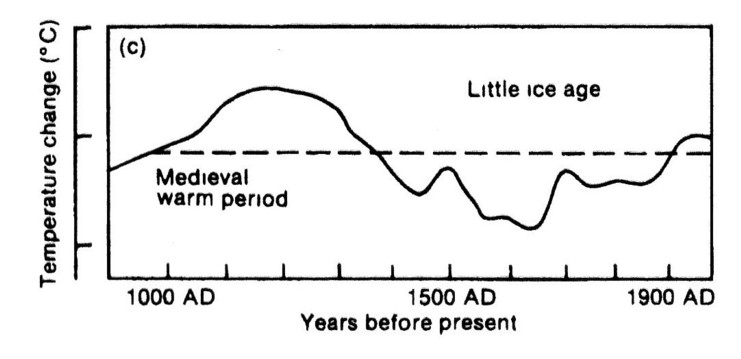
The version of “climate history” preferred by Happer was actually rather ill-defined. This “climate history” that Happer is so wedded to appears in the First IPCC Assessment Report in 1990. It is a “schematic diagram of global temperature variations” covering the last 1,000 years (Figure 7.1c, reproduced above). Being “schematic” it has an un-numbered vertical scale and the “dotted line nominally represents conditions near the beginning of the twentieth century.”
Also the horizontal axis demonstrates the lack of care in its preparation with the unnecessary “Years before present” label being copied from figs 7.1a & b. This is hardily the stuff of a well-founded and exact graphical representation.
The text of the 1990 report reinforces the tentative nature of this diagram. It makes plain that details of the MWP & LIA “are often poorly known because palaeo-climate data are frequently sparse.” The global extent of a MWP is questioned and the LIA is described as “not a period of continuous cold climate.”
So the 1990 report was far from saying the WMP & LIA were “fact” as Happer strongly implies.
THE HOCKEY STICK – PUTTING THE RECORD STRAIGHT
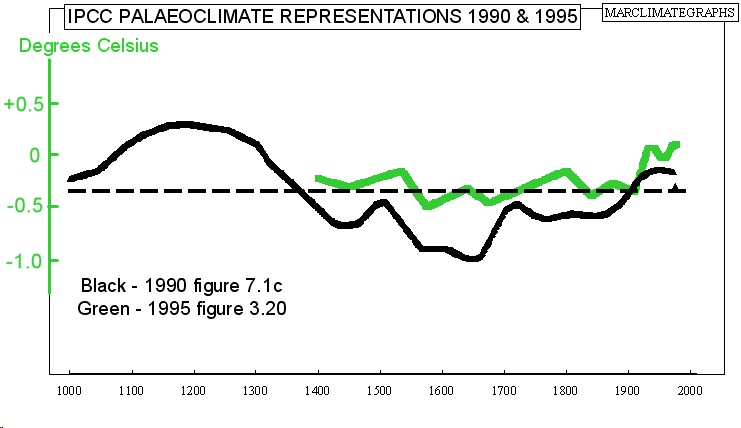
It was well before 2001 that the MWP & LIA began to disappear from “climate history.” Indeed, by the 1995 Second IPCC Report (available in its entirety as a 51MB pdf) the “schematic diagram” has already disappeared and been replaced by the beginnings of a hockey stick. “Figure 3.20. Decadal summer temperature index for the Northern Hemisphere“ spans the years 1400 to 1979. In this graph, temperatures no longer dip low during the LIA. Further, in the text this 1995 IPCC report directly questioned the existence of the MWP.
So the LIA was gone and the MWP was in serious doubt. Yet Happer makes no comment whatsoever about the 1995 IPCC report. Is he then happy with the figure 3.20? Or has he never read the 1995 IPCC report?
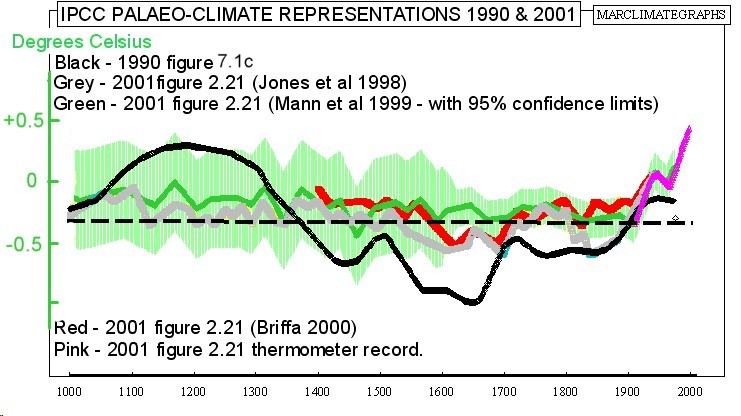
Only with the 2001 report does Happer complain about his precious MWP & LIA disappearing. And yet again it can be asked – has Happer ever read the 2001 report? He talks of “a graph.” Yet three temperature reconstructions are presented on two graphs, figure 2.20 (the hockey stick) & figure 2.21. He says “there was no explanation” for the MWP & LIA disappearing. Yet Section 2.3.3 is titled “Was there a “Little Ice Age” and a “Medieval Warm Period”?
Perhaps Happer only managed to read the Summary for Policymakers (where there is but one graph and no explanation) and failed to read further.
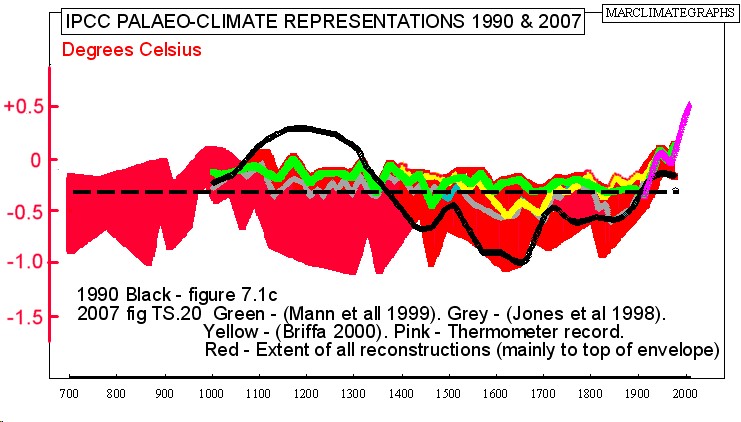
The Fourth IPCC Assessment Report of 2007 continues to feature the Hockey Stick data (now with a dozen other reconstructions), as well as directly refuting the very criticisms levelled by Happer against the original ‘hockey stick’ (see below Box 6.4) Yet for Happer the 2007 report isn’t even worthy of mention! Perhaps he felt it was not worthy of reading?
THE SUBSTANCE OF “STRONG EVIDENCE”
Happer says his view of the MWP & LIA is supported by “strong evidence.” He fails to say what this “strong evidence” is and reasonable researches yield nothing to support his claim.
The “schematic diagram” of 1990 is not based on “strong evidence.” The diagram comes from the work of HH Lamb reconstructing Central England temperatures who based the most recent 300 years on the Central England Temperature (CET) thermometer record. Earlier years in the reconstruction were quite speculative in nature. (Lamb’s original graph is accessible here. Also Box 6.4 here for IPCC comment on Lamb’s work.)
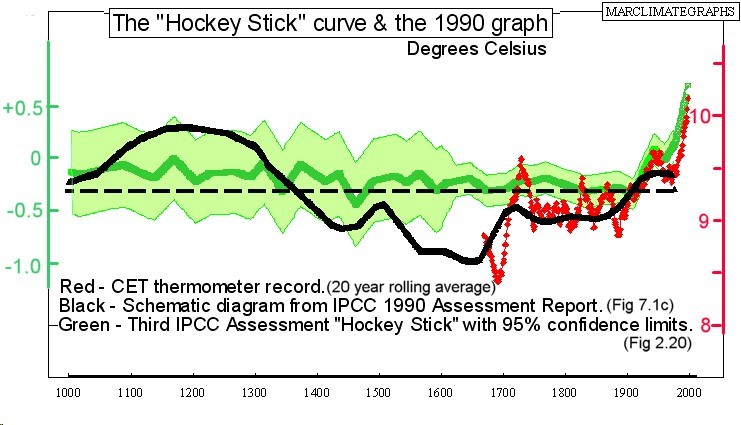
If this CET temperature record used by HH Lamb is plotted up-to-date, it plots out the ‘blade’ of the ‘hockey stick,’ as would be expected. The ‘handle’ of the ‘hockey stick’ becomes straightened because it is now based on a Northern Hemisphere average, not the more variable average of a single location (or the speculations of HH Lamb). Thus the 1990 “schematic diagram” becomes the ‘hockey stick’.
The only other possible hint Happer gives of “strong evidence” is mention of historical information – wine exported from England (also considered by Lamb) and a “greener” Greenland during the MWP, plus a frozen River Thames during the LIA. Of course this data applies only to two particular locations.
Further, such data can prove to be shaky even for local temperature reconstruction. Historical circumstance can be misinterpreted and even the accuracy of the information itself needs scrupulous checking. Such data used by Lamb has been checked and found wanting.
Concerning the historical frozen River Thames, available records appear to show it freezing both during MWP and the LIA. If true, this would make the frozen Thames less than convincing as evidence for a warm MWP preceding a cold LIA, even in merry olde England.
WHY PUBLISH DRIVEL?
Be it presenting The Truth About Greenhouse Gases or explaining the disappearing MWP & LIA, it is impossible not to conclude that Happer’s paper is entirely worthless.
The disclaimer says it expresses the view of the author not the GWPF. Yet it remains difficult to understand why any UK-registered “educational” charity would wish to publish it. When examined, it is so obviously nonsense and its publication cannot have been the unfortunate result from commissioning a piece of work because the paper had already been published, twice.
After four posts examining the work of the GWPF, little has been found of the slightest merit.
Their entire reputation as a factual commentator on global warming (which they are obliged to be under their UK-registered charity status) hangs by a thread. So in the next part of this series, the GWPF will be tested once more to see if their reputation can be redeemed.