
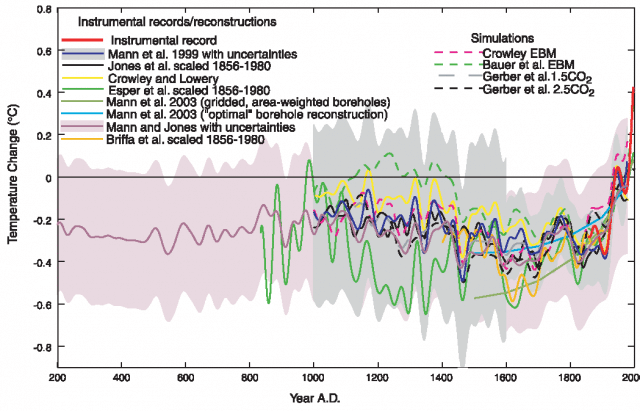
In the endless – and senseless – assault on Michael Mann and his famous hockey stick graph, it is generally overlooked that the graph has withstood all of the criticism and, still today, stands as a perfectly accurate picture of climate over the past millennia.
Most convincingly, its results have been replicated by other methods, using other proxies on more than a dozen occasions.
As well, however, Mann’s conclusions were vindicated in two independent reviews, the second of which, by Edward Wegman, was particularly hostile in it conception, but ultimately exculpatory. Arie Brand covered this so well in a comment to the next post that I felt compelled to reproduce his note here, for the convenience of those who are too offended by the trolls to pick through all of the excellent comments buried among the mindless criticisms.
Thank you Arie:
What are the facts:
In 2006 two reports were brought out on the politicized “hockey stick”. The earlier one, drawn up at the request of the US House Committee on Science, was drafted by a broadly based 12-member panel of the US National Academy of Science under the chairmanship of Professor Gerald North, and released on the 22nd of June of that year. The later and shorter one, for which the House Committee on Energy and Commerce took the initiative, was composed by a 3-member panel of the Academy’s Committee on Applied and Theoretical Statistics under the chairmanship of Professor Edward Wegman and was brought out in July.
For the whole debate on global warming the two vital questions were:
1. Is the research of Mann et all. leading to the hockey-stick graph essential for the hypothesis that the planet is currently undergoing a process of global warming that is at least in part caused by human activities?
2 Does the idea behind the hockey stick graph that the last few decades have been the hottest of the millennium have any validity?
Answer by the North Report to question 1:
The North-committee answered this question as follows:
“Surface temperature reconstructions for periods prior to the industrial era are only one of the multiple lines of evidence supporting the conclusion that climate warming is occurring in response to human activities, and they are not the primary evidence”.
Answer by the Wegman report to question 1:
The answer in the Wegman-report does not contradict this:
“In a real sense the paleoclimatic results of MBH 98/99” (that is the original hockey stick article by Mann et al. – AB) “are essentially irrelevant to the consensus on climate change. The instrumented temperature record since 1850 clearly indicates an increase in temperature.”
Answer by the North report to question 2:
Though the North-committee was not very happy with Mann et al.’s statistical method it nevertheless held that a whole array of evidence had confirmed Mann et al.’s original result and that on the whole the idea that the last few decades had been the warmest of the last millennium (thus including the so-called ‘medieval warm period’) was ‘plausible’ (a term panel members further elucidated by saying in the press conference following the release of the report that the odds for this having been the case were 2: 1) though one can have more confidence about this for the last 400 years than for the earlier period.
Here are the relevant statements from the North report:
“As part of their statistical methods, Mann et al. used a type of principal component analysis that tends to bias the shape of the reconstructions. A description of this effect is given in Chapter 9. In practice, this method, though not recommended, does not appear to unduly influence reconstructions of hemispheric mean temperature; reconstructions performed without using principal component analysis are qualitatively similar to the original curves presented by Mann et al. (Crowley and Lowry 2000, Huybers 2005, D’Arrigo et al. 2006, Hegerl et al. 2006).”
And:
“The basic conclusion of Mann et al. (1998, 1999) was that the late 20th century warmth in the Northern Hemisphere was unprecedented during at least the last 1,000 years. This conclusion has subsequently been supported by an array of evidence that includes the additional large-scale surface temperature reconstructions and documentation of the spatial coherence of recent warming described above (Cook et al. 2004, Moberg et al. 2005, Rutherford et al. 2005, D’Arrigo et al. 2006, Osborn and Briffa 2006, Wahl and Ammann in press), and also the pronounced changes in a variety of local proxy indicators described in previous chapters (e.g., Thompson et al. in press). Based on the analyses presented in the original papers by Mann et al. and this newer supporting evidence, the committee finds it plausible that the Northern Hemisphere was warmer during the last few decades of the 20th century than during any comparable period over the preceding millennium.”
Answer by the Wegman report to question 2:
Wegman et al. did not deny that the hockey stick graph could possibly give a valid indication of the change in temperature over the last millennium – they merely denied that this graph was adequately supported by Mann et al.’s original statistical analysis. In this context part of Professor Wegman’s oral testimony before the House committee on Energy and Commerce is revealing: “I am baffled by the claim that the incorrect method doesn’t matter because the answer is correct anyway. Method wrong + Answer correct=Bad science.” (It has been argued that the Wegman committee merely showed that Mann et al.’s analysis could produce spurious results, not that it actually did).
At any case for the wider community the basic question was not about Mann et al.s competence as statisticians, it was whether the hockey stick graph gives a reasonably correct indication of the change in temperature over the last millennium. We saw that the answer of the North-committee was that this was ‘plausible’ and that the idea was at any case supported by a whole array of evidence from other authors, also those using other statistical methods than Mann et al. The answer of the Wegman-committee contained nothing that is at odds with this conclusion.
Press reactions:
After the release of the first report reputable newspapers such as the New York Times and the Boston Globe concluded that the hockey stick graph had been vindicated. The NYT of 22nd June said: “A controversial paper asserting that recent warming in the Northern hemisphere was probably unrivaled for 1,000 years was endorsed today, with a few reservations, by a panel convened by the nation’s pre-eminent scientific body”. The Boston Globe said a day later: “A signature piece of evidence for global warming – a compilation of data showing that a sharp rise in temperatures made the late 20th century the warmest period in 1,000years – is probably true, a national panel of scientific specialists concluded yesterday.”
As to the charge that Mann et al. had ‘cherry picked’ the data to fit a pre-conceived graph the NYT also reported that the statistical expert of the North-committee, Professor Peter Bloomfield of North Carolina State University, stated during the press conference following the release of the report; “I saw nothing that spoke to me of any manipulation” and that his impression was that the study was ‘an honest attempt to construct a data analysis procedure.”
Perhaps I should add here that Pielke Jr., a scientist the ClimateAudit crowd likes to quote when it suits it, said at the time that the NAS-report amounted to an almost complete vindication of Mann et al.
In view of all this one is baffled by assertions that these two reports have “discredited” or “broken” the hockey stick, that Mann et al. had not merely used the wrong method (in arriving at the right result) but had deliberately picked out certain data to fit a pre-conceived thesis – claims one can only ascribe to an elaborate and devious PR-campaign.
To provide this all with a shred of evidence the purveyors of this nonsense have seized on a particular statement in the North as well as the Wegman report, namely that one could not have confidence in Mann et al.’s suggestion that it was likely that the nineties were the hottest decade of the millennium and 1998 the hottest year. The argument of the North committee here was that the data didn’t allow such precise indications from year to year and the Wegman-committee stated in general that such an assertion was not supported by the statistical method used by Mann et al.
It is clear that we are dealing here with a subsidiary thesis and that this does not detract from the claim by the North committee, that, overall, the graph provides a plausible indication of the changes in the average global temperature during the last millennium (one may add that the North committee was super-cautious here because if it is ‘plausible’ that the last few decades were the hottest in the millennium why wouldn’t it be ‘likely’ (the word used by Mann et al.) that the decade and year that according to the thermometer were the hottest of these decades would also be the hottest in the millennium?).
Subscribe to our newsletter
Stay up to date with DeSmog news and alerts