
This series of posts (1, 2, 3, 4) examines the UK-registered educational charity & climate-change denying think-tank the Global Warming Policy Foundation (GWPF). This fifth post examines one of the assertions made within GWPF Briefing Paper No1. The paper boldly claims that the findings of the UN IPCC are too narrow and that the work of “many scientists” is being ignored.
Can it be true? Is there “an alternative (scientific) view“ being overlooked by the IPCC? This would be a monumental discovery! Forget Briefing Paper No1. Let’s examine those overlooked scientists.
Yet despite the importance of this assertion, Briefing Paper No1 only manages to name one of these “many scientists.” He is Syun-Ichi Akasofu whose cited paper will now be examined.
(To be truthful, the work of Akasofu has been critically examined elsewhere but not well enough to entirely dismiss it summarily within the critique of Briefing Paper No1. This fifth post is thus clearing the decks of a bit of clutter ready for an examination of Briefing Paper No1 in the next post.)
THE THEORY AS STATED
Dr Akasofu is an octogenarian geophysicist at the University of Alaska Fairbanks. His 2010 paper “On Recovery From The Little Ice Age” cited by Briefing Paper No1 was published in Natural Science (Vol 2.11) whose publishers raise some achademic eyebrows. The 2010 paper is a much shortened version of an unpublished 2009 paper (50Mb pdf).
In these papers Akasofu presents the following thesis:-
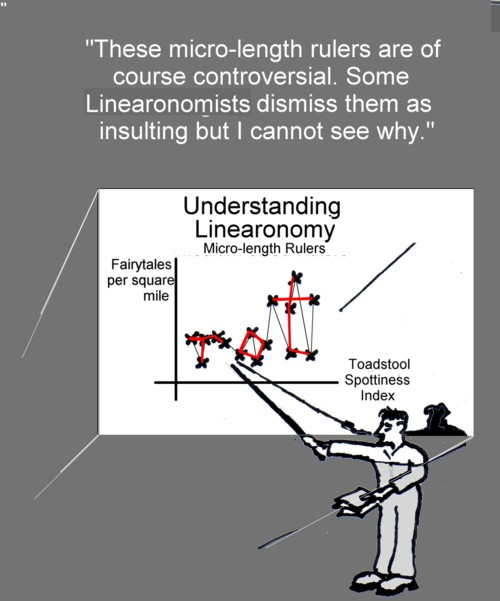
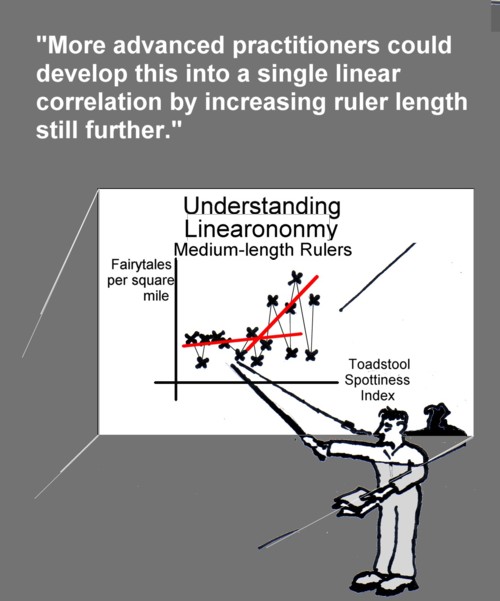
Global temperatures have been generally rising since 1800-50 when it was cold because of the Little Ice Age. According to Akasofu, this two-century temperature rise is linear in form, with multi-decade-long wobbles superimposed on top. Because this linear rise pre-dates any serious human greenhouse gas emissions, it must be natural and any calculation of man-made global warming must thus take account of this natural linear rise as well as the wobble.
So what to make of this linear temperature rise and of course, that wobble?
BEST WOULD HAVE BEEN BETTER
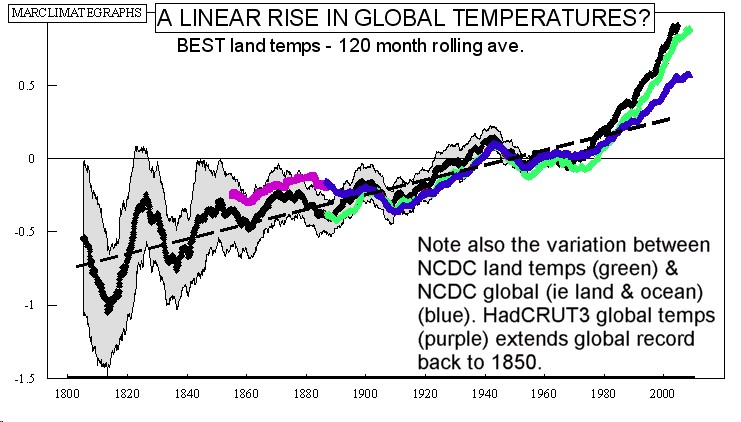
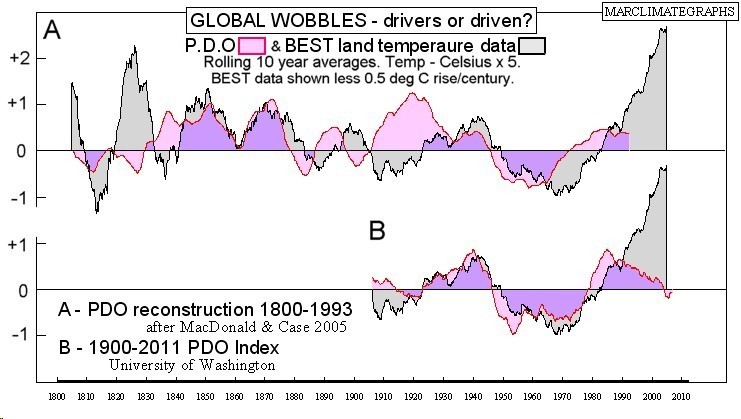
Akasofu would have been much helped in his thesis had the recent BEST land temperature analysis been available to him (as graphed below). He would then have been better able to concentrate on his linearity theory rather than concentrating as he did on establishing a general rise in recent temperatures stretching back to 1800-50 and to the end of the Little Ice Age. Indeed, his linear theory is sometimes conflated within this Little Ice Age linkage.
Even so, the total of evidence he presents for linearity is particularly sparse and also flawed. Indeed, the graph shown here (the graph below, not the one above) pretty much provides the whole of it – a straight line drawn through the global temperature record of the last 200 years with a rise of 0.5 deg C per century. It is a simple enough task for anybody armed with a straight ruler that is long enough for the job. And the BEST analysis of land temperature provides particularly helpful data for the task.
STRAIGHTENING OUT THE RECORD?
Much of Akasofu 2010 (& even more of Akasofu 2009) examines lots of different proxy data to establish the temperature record back to 1800-50. His conclusions are hardily different from the IPCC. Indeed his voluminous data includes the IPCC work. Why Akasofu needs such a volume of evidence is not clear. Perhaps he considers the IPCC reconstructions are not linear enough!
This voluminous evidence is not well presented. For instance he sources data from Vinje 1999 fig 1 (mistakenly cited as Vinje 2001 – reproduced in Akasofu 2010 fig 2d) which shows his precious Little Ice Age suddenly disappearing entirely during the period 1680-1780. Akasofu makes no comment on this strange twist within his evidence.
Such is the wide scope of evidence presented, the analysis is far from thorough to the point of being entirely cursory in places, even ending with an old favourite – the frozen River Thames.
A LINE WITH LITTLE SUPPORTING EVIDENCE
Beyond the temperature record itself, the sole evidence Akasofu advances directly to support the linearity theory is but one single sea level rise study, Holgate 2007. The linear findings of this small study (it uses just 9 tidal gauges although all with nearly continuous records) are not reproduced in other studies.
Bizarrely Akasofu 2010 does cite another study of past sea level rise (but for different purposes) whose title “Recent Global Sea Level Acceleration Started 200 Years Ago?”even suggests it contradicts Akasofu’s linear theory. Indeed this paper (Jevrejeva et al 2008) finds sea level rise in the twentieth century three times greater than that of the nineteenth – not very linear.
The sum of all this; Akasofu uses his voluminous evidence to fix the start of his supposedly linear trend. He finds dates varying from 1775 to 1850, a particularly large spread to conclude without any comment.
A SHAKY WOBBLY THEORY
More damning however is the quality of the evidence provided to support his wobble that he says overlays his linear trend. According to Akasofu’s wobble theory, global temperatures should now be in decline.
Akasofu states this decline is evident yet none of his evidence shows such a decline. His surface temperature evidence is sourced from Knight et al 2009 (cited as Kerr 2009) but this shows only less rise not a decline. Akasofu further ignores all other available work on this subject (e.g. Lean & Rind 2008 & 2009).
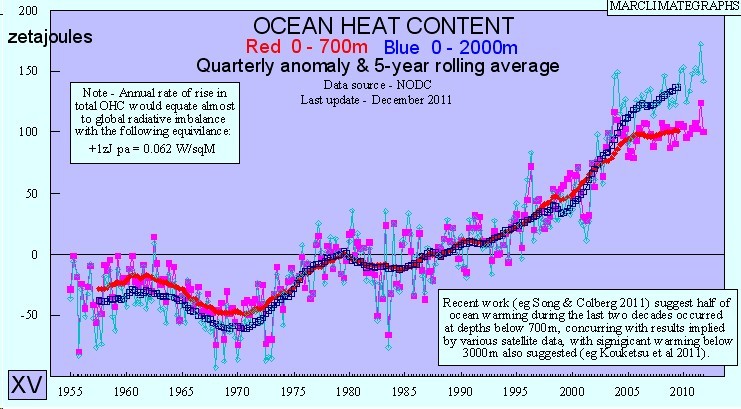
Ocean Heat Content is considered but only down to 700m and still he finds no decline.
Perhaps the strangest evidence here is that after two centuries of supposed linearity (remember the study with 9 tidal gauges he used supporting his linearity theory), sea level rise now allegedly exhibits some signs of Akasofu’s precious wobble. And this assertion is on the strength of but a few months data.
There are apparently “…other factors” beyond this evidence but Akasofu fails to say what. He also fails to mention the mountain of evidence that roundly contradicts his wobble theory. So yet again the level of scholarship within Akasofu 2010 proves dire.
AND IT‘S ALL BECAUSE…?
Akasofu 2010 does argue a possible cause of his linear global temperature rise, suggesting cosmic rays. However this suggestion is total nonsense.
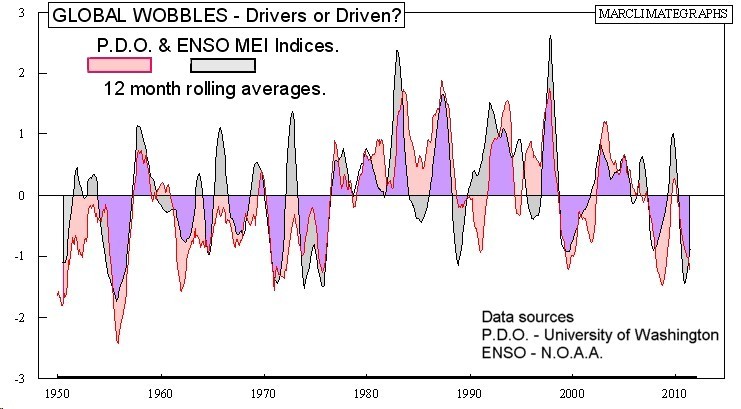
He is entirely unclear about possible underlying causes for his multi-decadal wobble, providing no more than a mention of the Pacific Decadal Oscillation, (PDO) another phenomenon that certainly does not drive climate change. The PDO does exhibit interesting wobbles but is it a driver or is it driven? In this Akasofu is as silent as he is about the more usual explanations for the ‘wobbly’ temperature record.
The Akasofu 2010 paper has not yet been further developed as would have been expected with a piece of valid science. And Akasofu’s theorising does require an awful lot of work because to advance scientifically it requires some as-yet unidentified physical phenomena to drive it all. As it stands, it is truly wild speculation.
CONCLUSION
Akasofu 2010 simply does not provide any credible science. GWPF Briefing Paper No1 asserts that the work of “many scientists“ is being ignored by the IPCC. As the only example cited is Akasofu 2010, the allegation is unfounded and thus can be dismissed.
In the next post in this series the rest of Briefing Paper No1 will be examined and the reputation of the GWPF finally established.