“An exposĂ© of planetary scale.”
~JAMES E. HANSEN  
 
Clearing the PR Pollution that Clouds Climate Science

Desmog Video

You need Flash player 8+ and JavaScript enabled to view this video.


WUWT: Just Enough Information to Mislead

You can’t beat Anthony Watts’ team at WUWT (either Watts Up With That or We Use Wishful Thinking, it’s hard to tell) for the delicate selection and presentation of “evidence” to argue that climate isn’t changing.

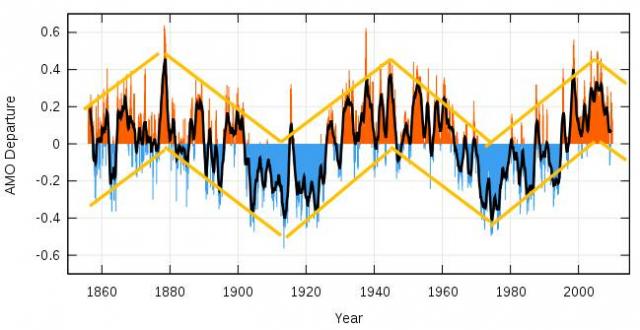
Here, for example, is a post that trumpets a Nature article on the climate effects of the Atlantic Multidecadal Oscillation. WUWT also credits the reputable German publication Der Spiegel as an intermediate source for this information and then posts the graph (left) as easy visual proof that what’s happening in climate today is all part of a normal up and down.

But have a close look at that graph. First, it doesn’t come from the Nature paper or from Der Spiegel. It was cobbled together on a denier site run by an engineer named Alan Cheetham.  Second, the yellow lines showing a downward resumption on the right side are based on - well, actually, on no data points whatever. While Cheetham may have a crystal ball, a touching optimism or a cavalier disregard for objective presentation, he has no evidence at all.

But he has a fan in Anthony Watts. Watt does that tell you?

I noticed this while reading another post in which Watts insults John Cook from the excellent blog, Skeptical Science (there is a link, incorrectly attributing the material above to New Scientist). Watt’s quotes this passage from Sourcewatch:

John Cook, on his website Skeptical Science, states that “the usual suspects in natural climate change – solar variations, volcanoes, Milankovitch cycles – are all conspicuous in their absence over the past three decades of warming.

… and then he goes on to provide three links (1, 2, 3) that purport counter Cook’s position.

Well, the whole post is dumb. Cook isn’t saying that there were NO ocean oscillations, volcano effects or Milankovitch cycles in the last 30 years. It seems clear that he was saying that global temperatures have been rising regardless that these influences have been absent, irrelevant or (in the case of volcanoes) acting to counteract warming.

Beyond being obtuse, Watts also has a little hissy about Cook using the “ugly word ‘denier’” in reference to people who, uh, manipulate or misrepresent scientific information to suggest that climate change is not happening, is natural or is nothing to worry about.

Watts the deal, Tony? Got a guilty conscience?


Comment viewing options

Select your preferred way to display the comments and click "Save settings" to activate your changes.

Anyone who states that the Milankovitch Cycles are at least partly responsible for the last 150 years of warming shows they haven't a clue what they are talking about. Milankovitch Cycles have periods of millennia, much too great a period to have any century-wide impacts. It is beyond irresponsible for anyone in the media, blogosphere, etc. to state this.

Actually the 60-year cycle seems to be quite real. See this new paper:

http://www.deas.harvard.edu/climate/seminars/pdfs/dts_jclim_2010.pdf

It is not true what Cheetham claims, that the general circulation models don't show this behaviour: they do, as the paper discusses. Of course the model cycle phase isn't synchronized with reality, but the behaviour is there. It's a natural (unforced) oscillation mode of the system.

And Scafetta's astronomical 'theory' for this is of course nonsense.

The yellow lines seem to be added by Alan Cheetham, but otherwise the image is from Wikipedia as shown in Cheetham's site.
And the Wikipedia page says that the authors plotted the data from NOAA. The URL shown is an old one before an internal reorganization of NOAA, but I arrived at a new URL by automatic redirection:
http://www.esrl.noaa.gov/psd/data/correlation/amon.us.long.data .
I find a page explaining the data at
http://www.esrl.noaa.gov/psd/data/timeseries/AMO/ .
It says:

Source:
* Timeseries is calculated at NOAA PSD.
Method:
1. Use the Kaplan SST dataset (5x5).
2. Compute the area weighted average over the N Atlantic, basically 0 to 70N.
3. Detrend that time series
4. Optionally smooth it with a 121 month smoother.

The file used by Wikipedia has not been subject to the optional smoothing mentioned as the item 4.
So, this is essentially a de-trended (see item 3) time series of sea surface temperature.

Comment viewing options

Select your preferred way to display the comments and click "Save settings" to activate your changes.

FOLLOW US!
 
SUBSCRIBE TO OUR E-NEWSLETTER
Get our Top 5 stories in your inbox weekly.
DESMOG TIP JAR
Help us clear the PR pollution that clouds climate science.

About the climate cover-up

About the climate cover-up

Democracy is utterly dependent upon an electorate that is accurately informed. In promoting climate change denial (and often denying their responsibility for doing so) industry has done more than endanger the environment. It has undermined democracy.

There is a vast difference between putting forth a point of view, honestly held, and intentionally sowing the seeds of confusion. Free speech does not include the right to deceive. Deception is not a point of view. And the right to disagree does not include a right to intentionally subvert the public awareness.


www.know-the-number.com

Our Climate is Changing!
Please download Flash Player.